Bearish Trap Appeared on Bitcoin Price Chart
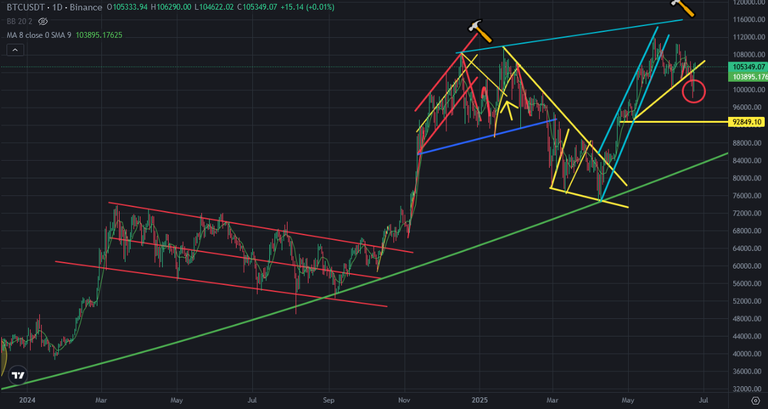
Even Bitcoin price broke down mini uptrend line, Bitcoin price reversed up fast and went above mini uptrend line again. Market maker made another bearish trap. Lots of investors got in FUD and trying to find support level for Bitcoin price chart. But It was only a bearish trap.
Here you can see daily chart of Bitcoin. There were lots of bearish and bullish traps. Bitcoin price is at safe level now. It should stay on mini uptrend line. But I said, market maker always makes fake moves. We may see another traps.
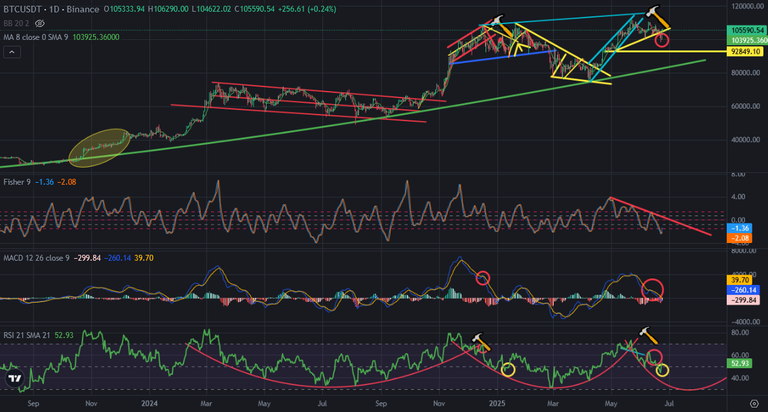
Here you can see the indicators on daily chart of Bitcoin. There is bowl pattern on RSI Indicator As I drew. Bitcoin price is moving as same as before. I circled the similarity on RSI Indicator. RSI Indicator will touch the bottom of great bowl pattern. But It is early. We will see it at the middle of July.
There is also downtrend line on Fisher Indicator. It will be broken up at the middle of July. MACD Indicator is moving as same as end of 2024. You can see what happened after these similarities..
I don't think that Bitcoin price will touch all time high in Summer. We should wait to complete the correction. Patterns shows us the future..
We will see..
Posted Using INLEO