After Bearish Trap, Hive Price is Going up Slowly
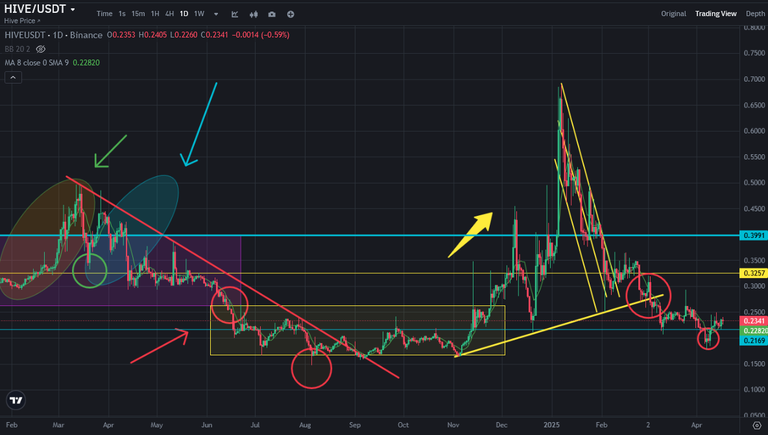
There was a bearish trap on Hive price chart. Market maker likes making traps on market. Hive made a bearish trap after breaking down 0,21 USD. It is one of great support level for Hive price chart. It is the middle line of depression zone where I drew on my draft shared a few years ago.
Here you can see daily chart of Hive and my draft. It worked as well. 0,21 USD was great support level. Even Hive broke down this level, Hive price pulled back and went up 0,21 USD. It is safe level to be on this support line..
After beatish trap on Hive price chart, it is going up slowly. Will it go up more?
Here you can see the indicators on Hive price chart. There is great support line on MACD Indicator. It is tested 3 times. It may be tested 4th time. If not, MACD Indicator will break down support line and we will meet the new price dump on crypto market. It is not only on Hive price chart. We can see same uptrend line on all altcoins MACD Indicator.
Fisher Indicators is on the top and may reverse down in a few days. If it reverses down after a few days, MACD Indicator may break down uptrend line. This is the negative scenario on Hive price chart.
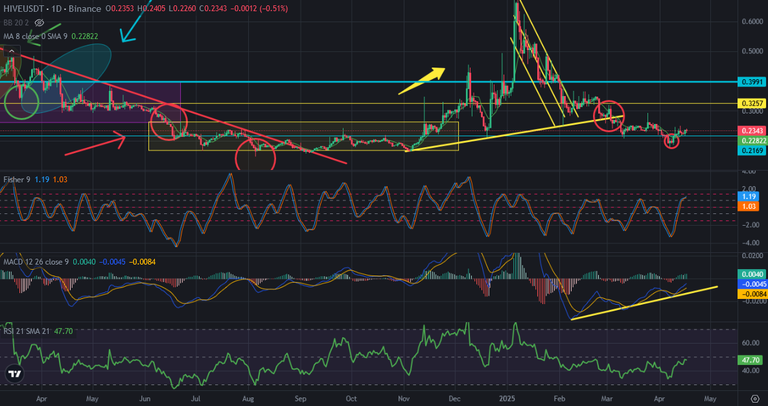
If negative scenario happens, we will see the support on Hive price chart at 0,21 USD level again.
We may see more bearish traps on Hive price chart.
We will see..
Posted Using INLEO