A Crossover will Occur on the Bitcoin Price Chart After a While
There are down and uptrend lines on Bitcoin price chart. We will see crossover on these trend lines. Bitcoin price went down fast from all time high level. After this price dump on Bitcoin price, we have seen price correction.
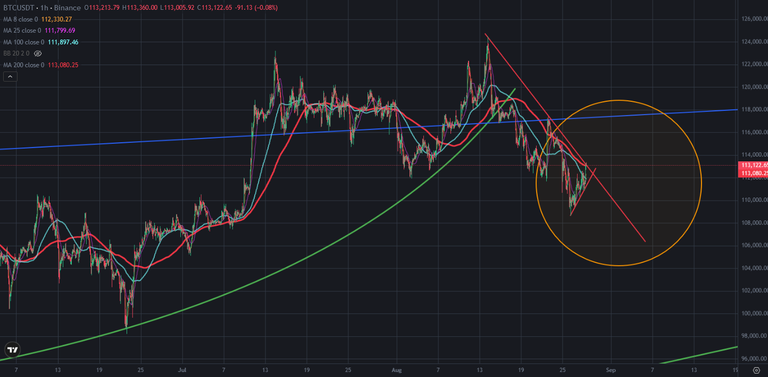
Here you can see hourly chart of Bitcoin price. Bitcoin price touched downtrend line coming from all time high level. There is mini support line on Bitcoin price chart that is following the price.
Even Bitcoin price breaks up this downtrend line, we may see retest this downtrend line.
Here you can see the indicators on daily chart of Bitcoin price. Even Bitcoin price broke down 100-day moving average which is great signal for trend, Bitcoin price is trying to touch this moving average. You can see what happened after breaking down this moving average.
Fisher and MACD Indicators are on the bottom and getting ready to reverse up. There is great bowl pattern on RSI Indicator. It may be great support for RSI Indicator.
If Bitcoin price reverses up from this level, it will be from the bottom. Because Bitcoin price is touching 100-day moving average and all of major indicators are on the bottom.

So, Bitcoin price is at decision point. We may see another wave of downtrend or we will see bullish attacks on Bitcoin price chart.
A Crossover is coming soon.
We will see..
Posted Using INLEO
This post has been manually curated by @bhattg from Indiaunited community. Join us on our Discord Server.
Do you know that you can earn a passive income by delegating your Leo power to @india-leo account? We share 100 % of the curation rewards with the delegators.
100% of the rewards from this comment goes to the curator for their manual curation efforts. Please encourage the curator @bhattg by upvoting this comment and support the community by voting the posts made by @indiaunited.