8th Weekly Green Candle is on Bitcoin Price Chart
Bitcoin price is going up at the beginning of the new week after 7 weekly green candles. We are getting closer to red weekly candles after these green candles series. Bitcoin price chart needs a price correction after going up from 76K to 112K. Bitcoin price went up without any price correction.
Here you can see weekly chart of Bitcoin. We have seen same scenario at the end of 2023. We may not see same scenario after this week. We are close to touch great resistance coming from top of all time high. Bitcoin price may reverse down if it touches 116K.
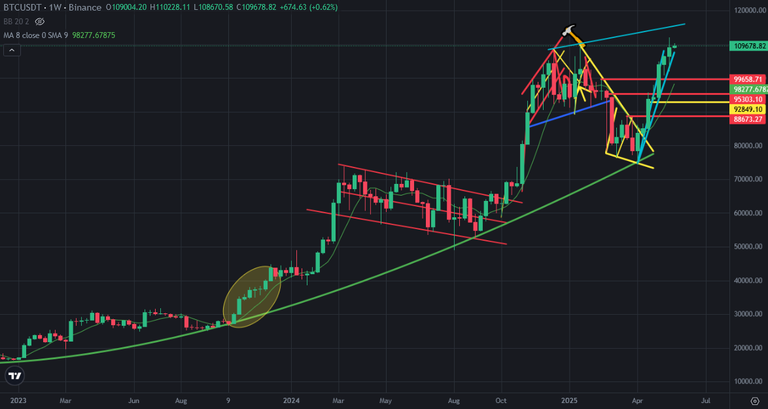
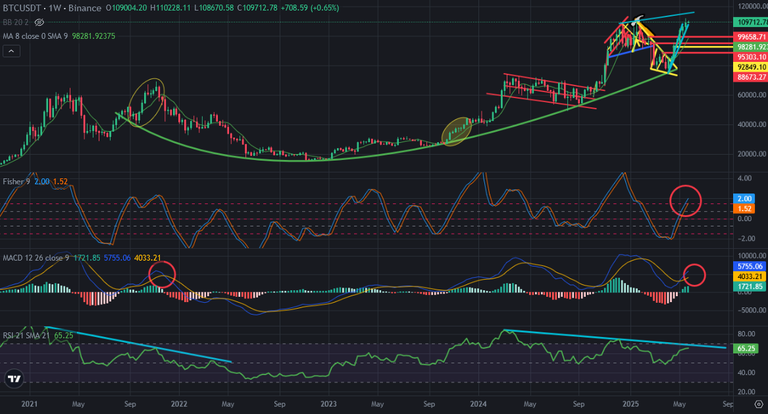
When we look at longterm of Bitcoin price chart, we can see same scenario as 2021. It seems horrible for Bitcoin price chart. Bitcoin price went up and reached 69K USD with 8 green weekly candle in last 9 weeks. It had only little red weekly candle when it reached 69K USD. We may see same senario now. Bitcoin price has 8 green weekly candles. We may see again McDonald's pattern on Bitcoin price chart.
When we look at the indicator of londterm weekly chart of Bitcoin we can see same moves.
I shared a few analysis about McDonald's pattern on Bitcoin price chart. We may see same pattern again.
After having 7 weekly green candles on Bitcoin price chart. We should be careful. We are getting closer to red weekly candle.
We will see...
Posted Using INLEO
https://www.reddit.com/r/CryptoCurrency/comments/1kvt3w9/8th_weekly_green_candle_is_on_bitcoin_price_chart/
This post has been shared on Reddit by @edeyglezsosa through the HivePosh initiative.