7th Green Candle on Weekly Chart of Bitcoin
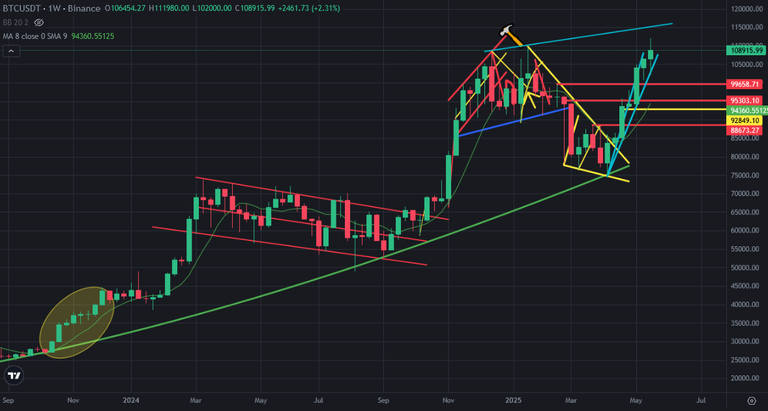
This is 7th week of Bitcoin price chart has green candles. We have seen these weekly candles series at the end of 2023. We are close to see red weekly candle on Bitcoin price chart.
Here you can see weekly chart of Bitcoin. We have seen 8 green weekly candles 1,5 years ago. Bitcoin is trying to continue green weekly candle series but there is great resistance on Bitcoin price chart at 115K USD where is line coming from the top of Bitcoin in 2025.
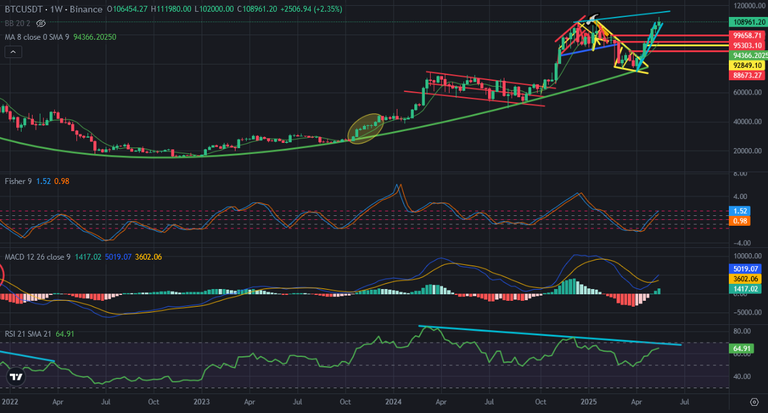
Here you can see the indicators on weekly chart of Bitcoin. There is negative divergence on RSI Indicator. Even the top of RSI Indicator is decreasing, the top of Bitcoin price is increasing. Fisher Indicator is close to reach the top. After reaching the top we will see reversing down in this indicator.
Market maker always do fake moves. We may see another one.
We are getting closer to see red weekly candle. I was thinking about red weekly candle in this week but market maker touched the price all time high. We may see it in next week.
We will see..
Posted Using INLEO
Wow..quite an impressive one , thanks for sharing this beautiful piece.
Indeed, the continuous appearance of green candles for 7 weeks in a row is a strong sign of upward momentum, but it’s very important to watch the 115k resistance, which seems like a strong psychological and technical barrier.
Wooo! 🚀 Bitcoin's seventh consecutive green weekly candle is already looking more like a stairway to heaven than a simple rally! 🟢🟢🟢🟢🟢🟢🟢 Could BTC be in "no one can stop me" mode? 😎 I loved how you explained the indicators, very to the point. Do you think we're entering a FOMO phase or is the warm-up just beginning? 🔥