5 Successive Weekly Green Candles are on Bitcoin Price Chart
This was the 5th week that Bitcoin price chart has 5 green weekly candles. We have seen these green candle 1.5 years ago. It is getting harder to see more weekly candle after these series.
Here you can see weekly chart of Bitcoin. I circled the last long weekly green series on Bitcoin price chart. Tomorrow is the first day of the next week. It will be harder to see green weekly candle than this week.
How many weekly green candles will we see?
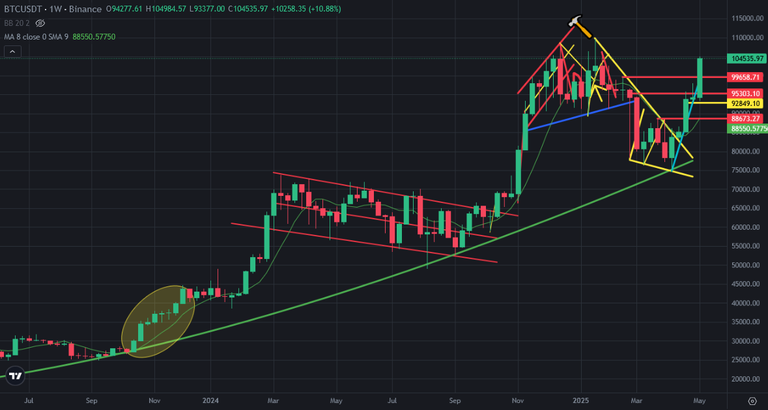
Here you can see the indicators on weekly chart of Bitcoin. After getting long green candles, Bitcoin price stayed as stable in 2023. What will Bitcoin do in this month?
Here you can see the move of the indicators of Bitcoin price chart while getting green candles and after this series. If we see same scenario on Bitcoin price chart, we can see what will happen on the indicators. So, we may be close to end of green candle series on Bitcoin price chart.
Next week may be the beginning of red candles.

I shared an analysis and said I was waiting for downtrend after half of this month. These weekly green candles series support also my thesis.
We will see..
Posted Using INLEO
Excellent analysis based on realistic observations from the weekly chart. Indeed, after a series of five weekly green candles, it becomes difficult for the price to continue rising without a correction.
Congratulations @chorock! You have completed the following achievement on the Hive blockchain And have been rewarded with New badge(s)
You can view your badges on your board and compare yourself to others in the Ranking
If you no longer want to receive notifications, reply to this comment with the word
STOP