Trading chart showcasing the QM pattern

The QM pattern is one of the price patterns in technical analysis, which is very similar to the head and shoulders pattern. Therefore, this pattern can be formed at the end of the downward trends or the end of the upward trends in the price chart according to the ascending or descending type. By using this pattern, traders can find the important areas of price reversal in the chart according to the general conditions of the price behavior in the relevant chart. For this purpose, it is necessary to pay attention to the formation position of this pattern in the relevant diagram.
What is the QM model?
The "Quasimodo" pattern, abbreviated as the QM pattern, is one of the types of reversal patterns in technical analysis that is formed at the end of trends. This pattern can be used in various time frames and markets. In other words, traders can see this pattern in Forex, stock market and commodity markets.
Identification of bearish QM pattern
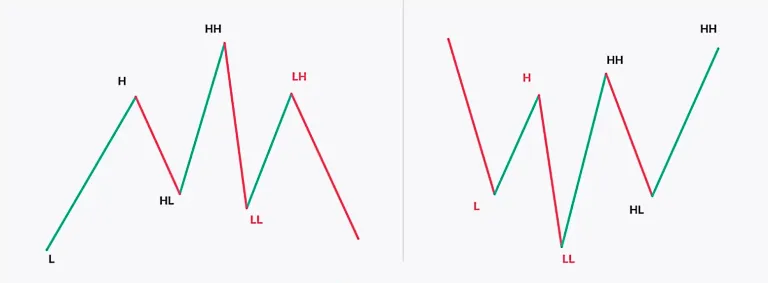
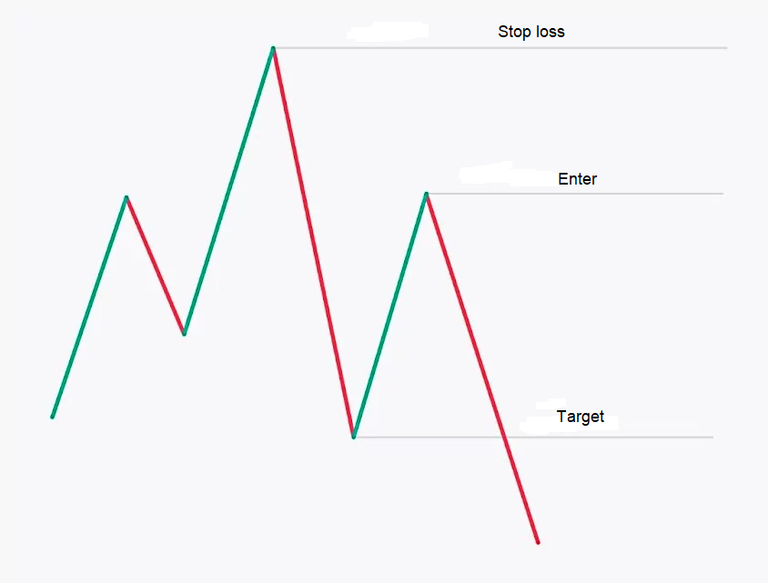
The bearish QM pattern is formed at the end of the upward trends in the chart and is a signal for the possibility of the formation of a new downward trend. This pattern consists of three peaks. that the middle peak is higher than the two side peaks. Therefore, this pattern, like the head and shoulder pattern, consists of a head and two shoulders next to it. This pattern also consists of two valleys or troughs. In the QM model, the second peak is higher and the second minimum is lower than the first minimum.
What is the bullish QM pattern?
The ascending QM pattern is formed at the end of the descending trends and is considered a signal to increase the probability of creating an ascending trend in the chart. A bullish QM pattern consists of three price lows that create an inverted head and shoulders pattern on the chart.
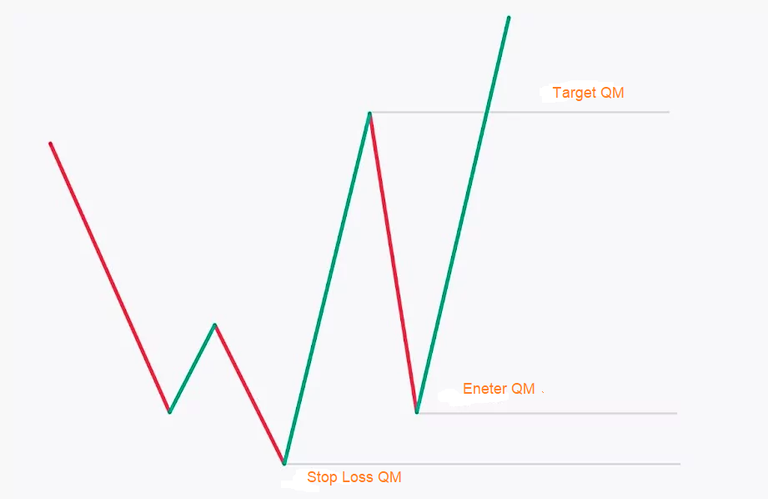
This pattern also consists of two peaks. In the ascending QM pattern, the second minimum is located at a lower level than its two side minimums. On the other hand, the second maximum in this pattern is formed at a higher level than the first maximum.

What is the importance of the QM pattern?
The QM pattern is important from the point of view that it shows fatigue in the continuation of the trend and creating a desire to reverse the trend in the target market.
Traders consider this pattern as a signal that indicates weakness in the current trend. The creation of weakness in the momentum of the movement of the trend indicates the possibility of a change in the sentiments of the relevant market. When traders observe the formation of the QM pattern on the chart, they can recognize the conflict between buyers and sellers.
The formation of this pattern in the price chart shows that traders do not want the price to cross a certain range. This issue reduces the strength of the current trend and ultimately increases the probability of the trend reversing.
The validity of QM pattern
The QM pattern is one of the strong patterns in identifying trend reversals. The validity of the QM pattern increases when we use it together with other technical analysis indicators such as the RSI indicator and the MACD indicator. Compared to other patterns in technical analysis such as the head and shoulder pattern, the QM pattern provides traders with unique entry and exit points.
This allows traders who seek to identify suitable positions to use reversal patterns to make profitable trades with the signals received from the QM pattern.
On the other hand, this model is more valid in markets with strong trends. In this case, with the formation of the QM pattern at the end of the respective trends, traders can more confidently predict the reversal of the trend in the relevant market.
Short position
Using the QM pattern, traders can enter a short trading position when the third peak is formed in this pattern. In order for traders to be able to manage their trades using this pattern, they can place trade targets at the level corresponding to the second minimum in this pattern. On the other hand, the level corresponding to the middle peak in this pattern is considered as the loss limit.

Long position
According to the bullish QM pattern in technical analysis, when the second shoulder is formed in this pattern, traders can enter a long trading position. Therefore, in order for traders to choose a suitable position to obtain optimal profit from the relevant market, they can enter a trading position when the third minimum is formed in the bullish QM pattern.
Next, to set a suitable level for exiting the trade, traders can consider the second maximum from the left as you can see in the picture below for Take Profit. On the other hand, the level corresponding to the lowest minimum in this pattern can be considered to set the loss limit in the relevant transaction.

Congratulations @brook.dev! You have completed the following achievement on the Hive blockchain And have been rewarded with New badge(s)
Your next target is to reach 200 upvotes.
You can view your badges on your board and compare yourself to others in the Ranking
If you no longer want to receive notifications, reply to this comment with the word
STOPCheck out our last posts: