Watching for the Perfect Retracements in Gold
Gold V SHAPE REVERSAL PATTERN? 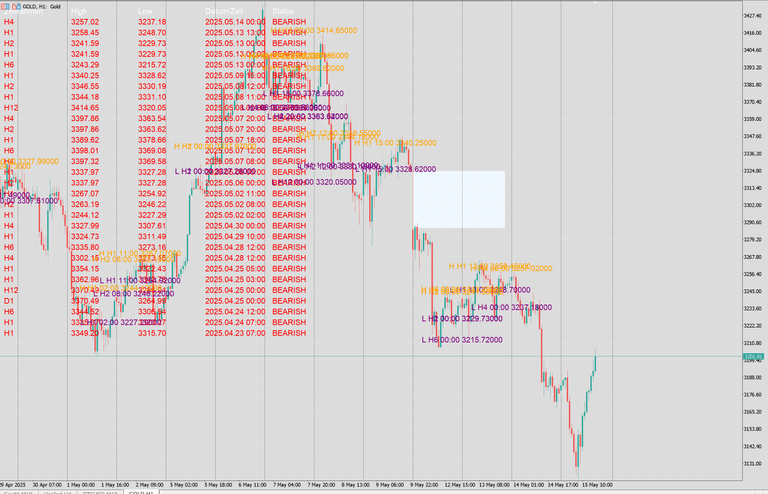
RETRACEMENTS 23,6 & 38,2 NEXT?
Will We At Least See the $3054 Level in Gold?
There’s no denying gold is in a consolidation phase, and anyone trying to chase quick profits here will regularly be disappointed. Consolidation means back-and-forth action—it drains trading accounts. Despite these challenging conditions, it’s still possible to trade with a proper setup. Since May 8th, we’ve seen persistent selling pressure. But perhaps it’s already time for price to retest previous breakout levels, with the ultimate upside target likely being the $3350 mark. Intermediate targets like closing the gap at $3324 could also offer a solid opportunity for a sharp countermove.
Right now, however, there’s no clear lower-timeframe opportunity to build long positions, as no significant timeframe is yet signaling a buy.
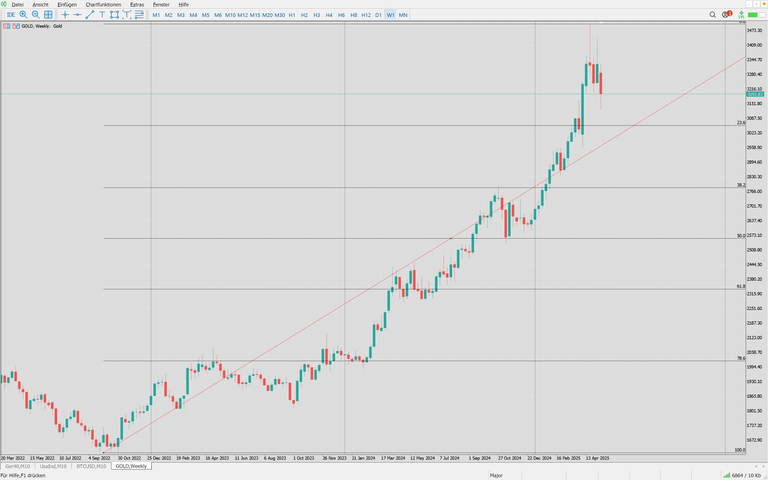
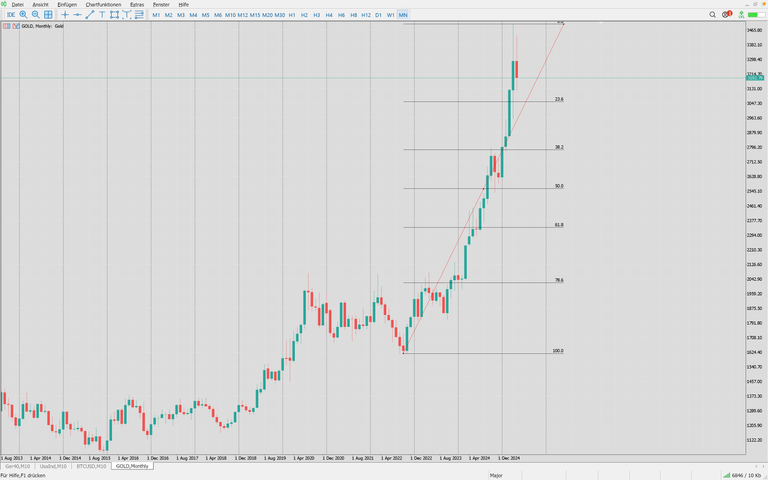
The higher timeframes (monthly and weekly charts) tell a completely different story, as nothing consequential has happened there yet. On the monthly chart, I applied Fibonacci retracement levels to the last major upward move, and it reveals we haven’t even reached the minimum threshold of a healthy, dynamic pullback. Generally speaking, the higher we consolidate, the greater the odds of further upside. The 23.6% and 38.2% retracement levels here are where the first buyers should step in.
The $2738 level is my line in the sand for distinguishing between a short-term correction and a prolonged consolidation phase. Prices shouldn’t drop below this level if gold is to maintain strong bullish momentum. A breakdown here would signal the start of a major consolidation phase, and my downside targets would then lie much lower.
Sehen wir zumindest die 3054-$-Marke im Gold?
Unbestritten ist, dass Gold in einer Konsolidierungsphase ist und jeder, der hier das Glück sucht, wird regelmäßig enttäuscht. Konsolidierung bedeutet hin und her – das macht Taschen leer. Trotz dieser widrigen Umstände ist es auch hier möglich, mit einem Setup zu handeln. Seit dem 8. Mai sehen wir kontinuierlich Verkäufe. Eventuell ist es jetzt schon an der Zeit, die ehemaligen Ausbrüche wieder anzulaufen, und das oberste Ziel wäre hier wohl die 3350-$-Marke. Zwischenziele wie der Gap-Close bei 3324 $ wären möglicherweise auch ein schönes Ziel für eine rasante Gegenbewegung.
Derzeit haben wir aber noch keine untergeordnete Möglichkeit, eine Kaufposition aufzubauen, da noch keine relevante Zeiteinheit hier etwas ausspuckt.
Auf den übergeordneten Zeiteinheiten wie dem Monats- und Wochenchart sieht die Sache schon ganz anders aus, da hier absolut noch nichts passiert ist. Auf dem Monatschart habe ich mal die letzte Aufwärtsbewegung für das Fibonacci-Retracement genommen, und dieses verrät: Wir haben nicht einmal das Minimum einer gesunden und dynamischen Erholung erreicht. Im Allgemeinen gilt hier: Je höher wir konsolidieren, desto größer ist die Wahrscheinlichkeit für weiter steigende Kurse. Das 23,6- und das 38,2-Retracement sind hier die Level für die ersten Käufer.
Die 2738-$-Marke ist für mich ein Level, an dem sich eine kurzfristige von einer langfristigen Konsolidierung unterscheidet. Tiefer sollte es nicht gehen, um ein wirklich dynamisches und starkes Zeichen zu setzen. Alles unter dieser Marke würde bei mir den Versuch einer großen Konsolidierung ankündigen, und meine Ziele auf der Unterseite sind dann noch sehr weit entfernt.
Posted Using INLEO