Next Pump in NASDAQ Chart
Is There Another Floor to Go?
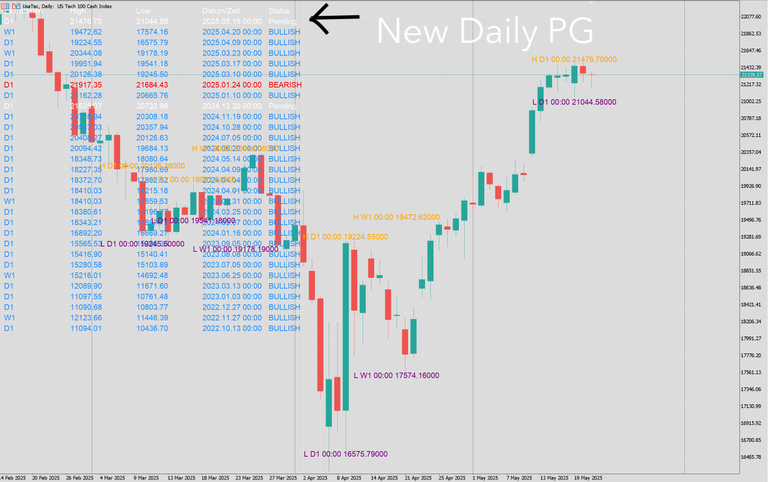
The NASDAQ recently kicked off the week with a celebration, and after starting off slowly from the 19,472-point mark, it has been climbing steadily—and now, at an accelerating pace. As often happens, signals rarely come alone, and this week, another one appeared on the daily chart. As we know, the Americans have perfected the art of sharp reversal patterns, so it’s no surprise that the bulls still aren’t satisfied. In most cases, after a major breakout, new signals gradually form on lower timeframes—similar to aftershocks following an earthquake.
The sequence is nearly always the same: first the weekly chart, then the daily, followed by smaller timeframes—just like the stages of an eruption. A new all-time high, of course, is inevitable, and this time, it’s happening less than a month after panic selling. Now we’re back in the phase where we spend most of our time in the market, and to put it in sentiment terms: greed has returned. While extreme greed hasn’t peaked yet, what isn’t today may still come tomorrow. The same goes for Bitcoin, which, as I write this, is probably breaking its all-time high.
Is this the start of the summer lull, where we drift into thin air and later consolidate at even higher levels? If everything is back to normal now, why isn’t gold crashing? All these questions will be answered in the coming weeks, but FOMO is back—and with it, the never-ending marathon parties.
Geht es noch eine Etage weiter?
Der NASDAQ feierte zuletzt auf dem Wochenstart, eine Party und von der 19.472 Punkte Marke ging es anfangs langsam und jetzt immer schneller weiter in die Höhe. Wie es oft mal ist, da kommt ein Signal nicht alleine und diese Woche hat sich ein Signal auf dem Tages Chart dazu gesellt. Die Perfektion von einer scharfen Umkehrformation beherrschen die Amerikaner ja perfekt wie wir wissen und so wundert es auch nicht, dass die Bullen wohl noch nicht genug haben. In den meisten Fällen bilden sich stetig neue Signale auf den untergeordneten Zeiteinheiten nach einem großen Ausbruch, ähnlich wie bei einem Erdbeben.
Über die Woche und anschließend über den Tages Chart und daraufhin auf die kleineren Zeiteinheiten, so ist der Ablauf in nahezu allen Fällen einer Eruption. Ein neuer Allzeit Höchststand darf natürlich nicht fehlen und das nicht einmal nach einen Monat nach den Panikverkäufen. Jetzt ist die Zeit mal wieder da, in der wir uns die meiste Zeit befinden, am Markt und um die Sprache vom Sentiment auszudrücken, es besteht Gier am Markt. Zwar ist der höchste Bereich extreme Gier noch nicht erreicht, aber was nicht ist, kann ja noch kommen. Das Gleiche gilt natürlich auch für den Bitcoin, der während ich hier schreibe wahrscheinlich das all time High knackt.
Ist es schon der Start von dem Sommerloch und wir schieben uns jetzt in die luftigen Höhen und konsolidieren später irgendwo auf noch höhere Niveau? Wenn jetzt alles wieder in Ordnung ist, warum stürzt das Gold nicht ab? All diese Fragen werden uns die nächsten Wochen beantworten, aber die FOMO ist wieder da und somit auch die ewigen Marathon Partys.
Sending Love and Ecency Curation Vote!
 Please Vote for our New Proposal! 🙏