Our little farm(er's market)
First, this is my first attempt in gathering, analyzing and interpreting data since college. I'm a bit on a limb here, meaning I need help, meaning if you find that any procedure, calculation and/or argumentation that I used is completely flawed, please let me know!
Second, this is the first part of the "study". I want to make sure that I'm not doing a bad job, inflating or deflating numbers, as I want to present this report officially to argue for our Farmer's Market in the future.
Thank you in advance for your help!
Foreword
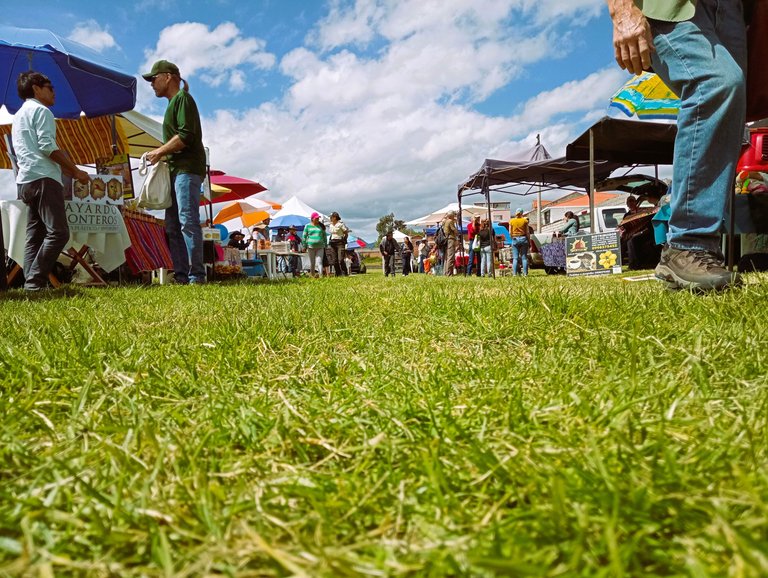
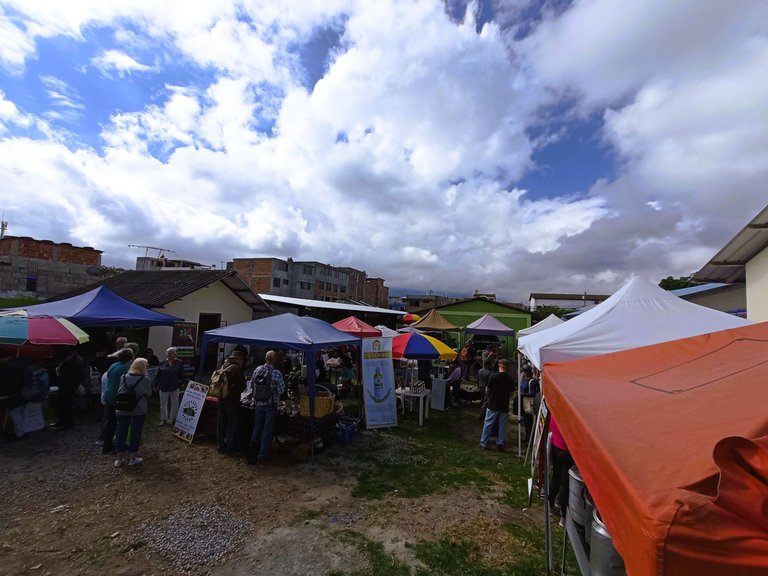
The Cotacachi Farmer’s Market is an independent, community-driven market in Cotacachi, Imbabura, Ecuador that gives producers from the region a place to sell, focusing on organic and artisan products. Besides the economical and ecological impacts, it has also turned into a cultural hub, bringing together a vast variety of ethnicities, cultures and nationalities.
It’s been 10 years now since Lindsay Numedahl started this adventure, and we’ve since come along way. From 5 vendors to over 105 vendors, from only expat vendors to mostly Ecuadorian sellers, from only expat clients to a healthy 50/50 mix. We handled ourselves through many ups and downs, including a pandemic, nationwide strikes and a total of 6 moves, among other difficulties.
In July 2025, we conducted a survey to quantify the extent of our impact. This is not a professional survey, nor is the data analysis and interpretation a solemn truth. As with everything regarding our little big market, there’s a multitude of perspectives to take into account, including misunderstanding questions, illiteracy, calculation problems, and others that might have affected the outcome. But with a total of 98 answers, we hope to have reached a big enough sample to balance out those errors.
We will go through each question with the respective range of answers, and then work through some correlations. Survey and interpretation are done by me, one of the co-founders of the Farmer’s Market.
Note: The numbers displayed were created in a German excel-sheet. Thousands are separated by dots (.), while decimals are separated by comma (,). That’s opposite to some countries, especially the USA.
Question 1 - Revenue
Question:
What’s your average revenue at the Farmer’s Market?
[ ] $0 - $25
[ ] $26 - $50
[ ] $51 - $100
[ ] $101 - $250
[ ] $251- $500
[ ] $501- $1000
[ ] more than $1000
Data Analysis
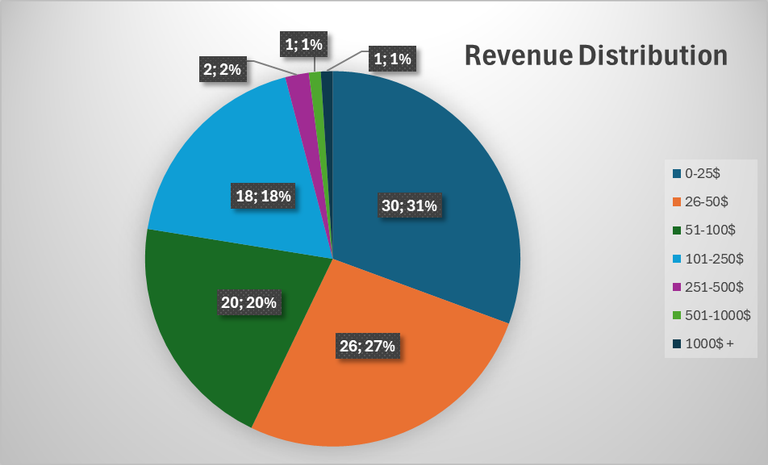
Since we couldn’t ask everyone for the exact average revenue, we settled for ranges. I used the middle of each range to calculate the total income. Please consider that due to that process, there is a margin of error involved in the calculation for total revenue generated on each market day.
The median of the answers for average revenue generated in one day lies in the 26-50$ range. With that, we can establish that half of our members sell more than 50$ per day, and the other half less than 50$. Among the 6 segments we chose, this places the typical revenue of one vendor in the second-lowest tier. Though that sounds disappointing, it actually indicates that although many of us are operate on a smaller scale, we also have a good amount of vendors operating with modest Revenue levels.
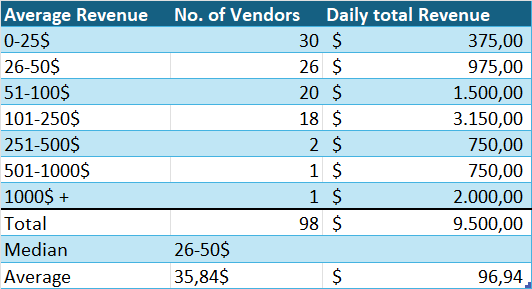
The calculated average income based on the answers is 35,84$. In Cotacachi, the income for an 8h day of work is often around 15$, depending on qualification. Considering that the market only lasts for 3 hours (9am to 12pm), generating that kind of average revenue is a great sign for us. Those 35,84$ were calculated via standardization, giving each range a value (1 to 6), in order to reduce the effect of the outliers.
If we factor in the outliers and the calculated total daily revenue, we come to an average income of 96,94$. For that calculation, the midpoint of each range was taken and multiplied by the number of vendors that marked that range.
With the discussed method, I calculated an 9500$ in average daily revenue is a lot in Ecuador, especially for a small town like Cotacachi. That means, our vendors generate an estimated revenue of $500.000 per year. If we use only the median as a metric, we land in a range of 141.960$ to 273.000$ per year, which is still significant. That median, though leveled out the outliers, which do generate a big portion of the total revenue. The truth probably lies somewhere in the middle, as always.
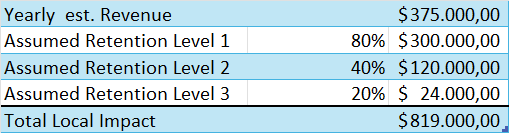
Local Impact
Considering that most of that money not only stays within Cotacachi, but is multiplied through the chain of consumption, the overall economic impact is probably a lot higher. As most of our vendors are artisans or local farmers, a big part of the generated revenue stays in Cotacachi.
I estimate a 20% leakage due to taxes, imported goods, external services, meaning the retention rate is around 80% on the first level (the vendors using their revenue to pay workers and such).
On level 2 (the people paid with money from level 1), the retention rate is lower, for example because people use that money to buy things at Tia, our local supermarket that is part of a national conglomerate. I estimate a 40%, as they still pay rent and other expenses that stay locally.
On Level 3, I guess it’s only 20%, maybe even lower, as many parts of daily consumption are part unfortunately go towards giants.
It’s really hard to find data to compare that to. I could say that with an GDP per capita in Ecuador of 6.600$ and 10.000 inhabitants of the city of Cotacachi, the GDP of Cotacachi is 6,6 Mio. $, which is somewhat likely. But including the rural areas and hence the whole canton of Cotacachi with its 40.000 inhabitants, we can’t use the same GDP, as the income in rural areas is even lower than I the city.
Hence, my conclusions is based on my perception. And that is that our little big Farmer’s Market has a big economic impact here. And that is awesome.
That's it so far. It took me quite a while to get the numbers crunched. Writing the text is not as difficult, but I want to make sure I got it somewhat right, that it's acceptable considering my level of non-expertise.
So, again, thank you for reading and taking the time to point out the flaws in my procedures and argumentation! Also, if you think that other points could be made, please let me know!
plot a frequency histogram of those bins, the pie chart won't bake the pie :)
That's easy enough :-) Is that all? No big flaws in the argumentation and interpretation? No horrendous mistake in the data analysis?
I was especially unsure about giving each answer from 1-6 (1 being 0-25, and 6 being 1000+) to reduce the outlier impact and get a more realistic average, as well as taking the median of each range to calculate the total.
Just pulled in additional data from the two outliers, so I can adjust that data to be closer to the truths.
I got more data ready, just need some time to go through it. I did quite a few "COUNTIFS" (a new formular I learned!) to see some of the relations, which is very interesting and informative.
Since some people sell several things, and I didn't find a way to include the multiple answers, I took each answer of product type as one - hence getting to a total of 125. Still, I can get much insight out of this survey and charts - will keep working on it, and hopefully able to present a full report one day :-)
Flaws will emerge after you plot.
What you have plotted now is a bar chart. What you need first :
A frequency histogram on a equal sized bins, a bit finer than you have
Then a probability density histogram with a log normal fit
Label all statistical parameters like mean median mode and std dev and we can see the flaws easily.
Just the revenue data is enough.
Oh, the one I posted was the countif for what people sell in relation to how much revenue they generate.
I will look up all those words that your wrote, because I didn't understand a thing there 😅 Statistics class is just too long ago... But it's a lot of fun to revive some. Thank you for the help and support, as always!
Ha ha ha.
It will be a long night :)
@azircon okay, here we go. This was not easy. The survey was done with the ranges displayed, it was not a specific numeric answer. In order to create the histograms, I had to estimate a distribution on a 25$-bin width. I excluded the 650$ and the 1800$ outliers as they're just way to out. Since I have some insight from experience, I think I estimated somewhat correctly.
well done!
now we are talking!
How do you feel about the data?
Exhausted and confused. Mainly. I have to look up what all those values mean again...
What is the median revenue?
$37.5?
European keyboard gives me creeps with comma!
yes, it would be $37.5 when using the medians of the ranges.
A Standard dev of 1,049 represents what I experience at the market. We have a few high-revenue posts, and many low-revenue posts.
the Median of LN is 3,75. If my googling is right, I have to return that into $ in order to get the median revenue according to my estimations of who has how much revenue. That would be e^3.75, 42.50$. That is around 7$ off my calculation, but as I said, I had to estimate which vendors generate how much revenue. If my estimates are right, well, the median revenue is 42.50$. If I stick to the basic statistics I use in the post, it's $35.84.
It's hard to decide which to use. Withing the range of 0-25$, I'm pretty sure that quite a few make below 10$ income on average a day, as they don't even have that much produce that they bring, and some days they don't sell anything (especially the veggies are repetitive). Hence, my tendency to the $35.
After you rest, maybe tomorrow and day after. Replot and don’t ignore the high bin, even if it requires empty area. You will see that it will pull your mean high but won’t change your median by much.
That is because you have high right positive skewness :) typical of this data.
Tomorrow is market day... I'll just put it in today. It shouldn't take much long to put in that extra data, it's just pulling down formulas.
and now what is your Mean, Median and St Dev?
It's the same. The Median and St. Dev were calculated with the same data. I only excluded them in the diagrams as they make them veeeeery long.
Correct.
There is a function in excel that can calculates all those with one click from your frequency distribution.
Here in this data Median is perhaps most significant which is $37. Most people's revenue is that.
But some crazy guy like me, may be interested in the tail of that log normal distribution and look for that single high number and research why that sale was that high and how to replicate that.
A lot of my academic research and current job investigates tails of these right skew log normal distribution.
Wealth distribution, Human intelligence, Spreading rate of virus, Size of oil fields...............they are all right skewed log normal distributions. The issue is how do you predict this exact distribution just from a severely under sample data. How do you predict an event, that is catastrophic, that hides in the long tail?
We call it the black swan.
AND YOU TELL ME THAT NOW??????? 🤣🤣🤣🤣
So... The founder and I are Black Swans? That's so cool. She's going to love that. And it does make sense, both our incomes combined are 25% of the total revenue of the market, while being only 2% of the market.
So when you work on gas and oil, do you work in the same way, just with samples? Getting as many samples as possible, plotting them, and calculating the probability of each sample bin width being the most representative?
Yes and yes :)
Natural world is log normal. All you are trying to do is to find the mean, median and standard deviation!
That’s the first task.
Then you predict a single outcome.
If you can do that, you can have my job :)
Jetting around the world and getting paid well for that? Doesn't sound too bad... I think you mentioned team management as well, I do have experience in that. What I don't think is that it would line up with my character, and what I want to achieve in my life 🙃
Thank you so much for tutoring me through this, more or less! It was indeed very interesting, and I feel like I understand those values a lot better now.
It does seem like I'm going back to school these days. Math reminds me of storytelling sometimes. Not only in the statistics we just went through, but generally. The other day, I wanted to calculate how much bread we'd have to sell to make it worth a trip to Puerto Lopez, including fix cost, wished profit, ingredients cost and the cut that the baker made from the income. In the end, I did it on paper, as I needed to write down the story in numbers:
But I used the wrong command for the median, it's actually the mean.
Here they are correct. 3.62 is the LN for 37.5
Also, when looking at SD and LN, it seems like my basic statistics in the post are not too far off the truth. The results are somewhat aligned, both my standardized average as well as the median as well as the LN are in the $26-50 Range.
You see, you find your flaw :)
This is what I expected.
That looks amazing! Keep it up.