ETH/USDT Chart Analysis (APRIL 2025)
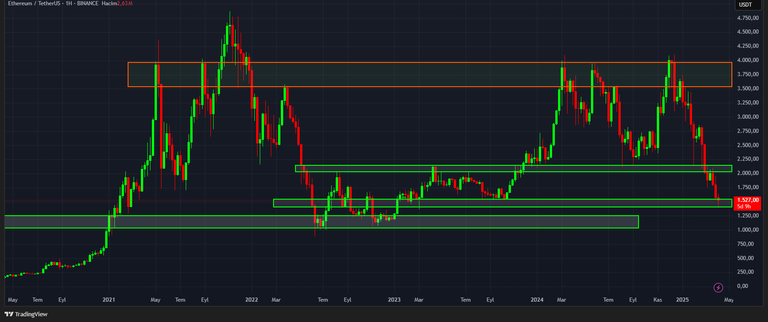
Hello again. I wanted to share a new ETH chart. I shared the ETHEREUM chart I follow in January. First, I recommend you to take a look at the chart I mentioned. The first chart is in the weekly time frame. I preferred the price data of Binance Exchange. Screenshots are from Tradingview.
The chart below is in the 240-minute time frame.
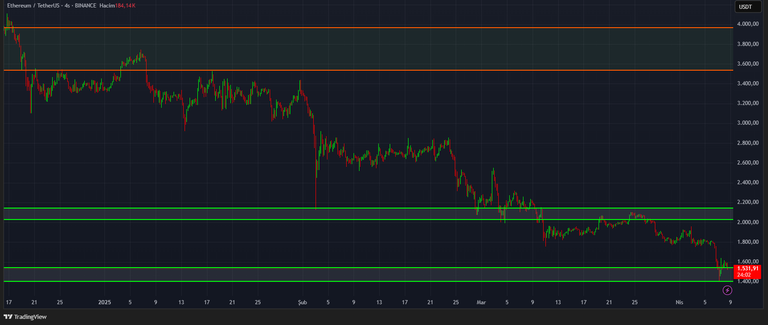
The supply-demand zone where the price is located is in the 1400-1540 price range. The supply-demand zone in the middle is in the 2030-2140 price range. There is a wide demand-demand zone above. The price range is in the 3550-4000 price range. According to Binance Exchange data, Ethereum recorded its historical peak of $ 4,850 in November 2021. The $ 4,100 level was recently tested. The date is December 16, 2024.
I am not an investment consultant. You should make investment and trading decisions according to your own financial and psychological state. It would be more useful to see such analysis sharing as an educational study. See you again. Stay tuned.
Posted Using INLEO
Great chart description again. We hope the chart become more impressive with time. Can’t wait for all the down swings to stop swingi
I love crypto stats and information like this! Thanks a lot! 😁 🙏 💚 ✨ 🤙