AVAX/USDT Chart Analysis (January 2025)
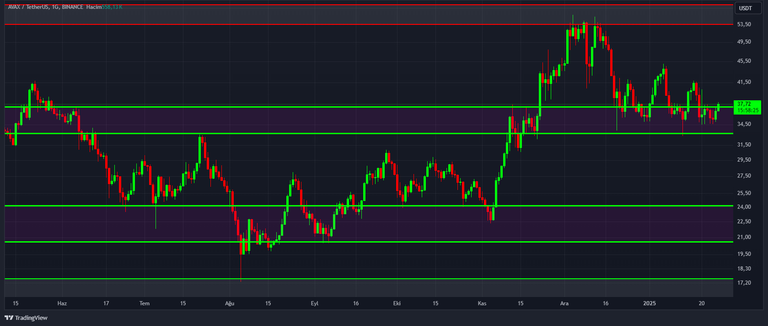
Hello everyone. I haven't published an Avax chart for a long time. Avax is one of the cryptocurrencies that I follow the price data of, both because I trade and because I follow the blockchain. I wanted to share the chart that I follow with you. The price data is from Binance Exchange. I took the screenshot of the chart from Tradingview. I follow the price in the daily time frame.

The supply-demand zone where the price is located passes through the 33-37 level. The supply-demand zone below is at the 20-24 dollar level. The supply-demand zone above is at the 53-58 level. Above, there is a wide supply-demand zone in the price range of 98-128 dollars.
I am not an investment consultant. You should make investment and trading decisions according to your own financial and psychological state. It would be more useful to see such analysis sharing as an educational study. See you again. Stay tuned.
Posted Using INLEO
Supply Demand Zone is very important trading, let's see what happens
Thanks a lot for the analysis and information! I hadn't heard of Avax before. 😁🙏💚✨🤙
Congratulations @anadolu! You have completed the following achievement on the Hive blockchain And have been rewarded with New badge(s)
Your next target is to reach 68000 upvotes.
You can view your badges on your board and compare yourself to others in the Ranking
If you no longer want to receive notifications, reply to this comment with the word
STOPCheck out our last posts: