Understanding Stochastic RSI: A Powerful Momentum Indicator 🙂
Introduction
In the world of technical analysis, understanding and interpreting momentum indicators is crucial for traders who aim to predict future price movements. One such powerful tool is the Stochastic Relative Strength Index (Stochastic RSI). This indicator combines the principles of the Relative Strength Index (RSI) and the Stochastic Oscillator to provide more sensitive and potentially more accurate signals about overbought or oversold conditions. In this article, we will delve into what the Stochastic RSI is, how it is calculated, and how traders can use it effectively in their trading strategies.
What is Stochastic RSI? 🤔
Stochastic RSI is an advanced momentum oscillator that shows the level of the RSI relative to its high-low range over a set period of time. It is essentially the Stochastic Oscillator applied to the RSI rather than to price data. This results in an indicator that oscillates between 0 and 1 (or 0 and 100 if multiplied by 100), providing more frequent and earlier signals of potential market reversals relative to the traditional RSI.
The Stochastic RSI was introduced in the book The New Technical Trader by Stanley Kroll and Tushar Chande in 1994. It is particularly useful in markets that are experiencing strong trends, where the traditional RSI might not be as responsive.
Interpreting Stochastic RSI 😃
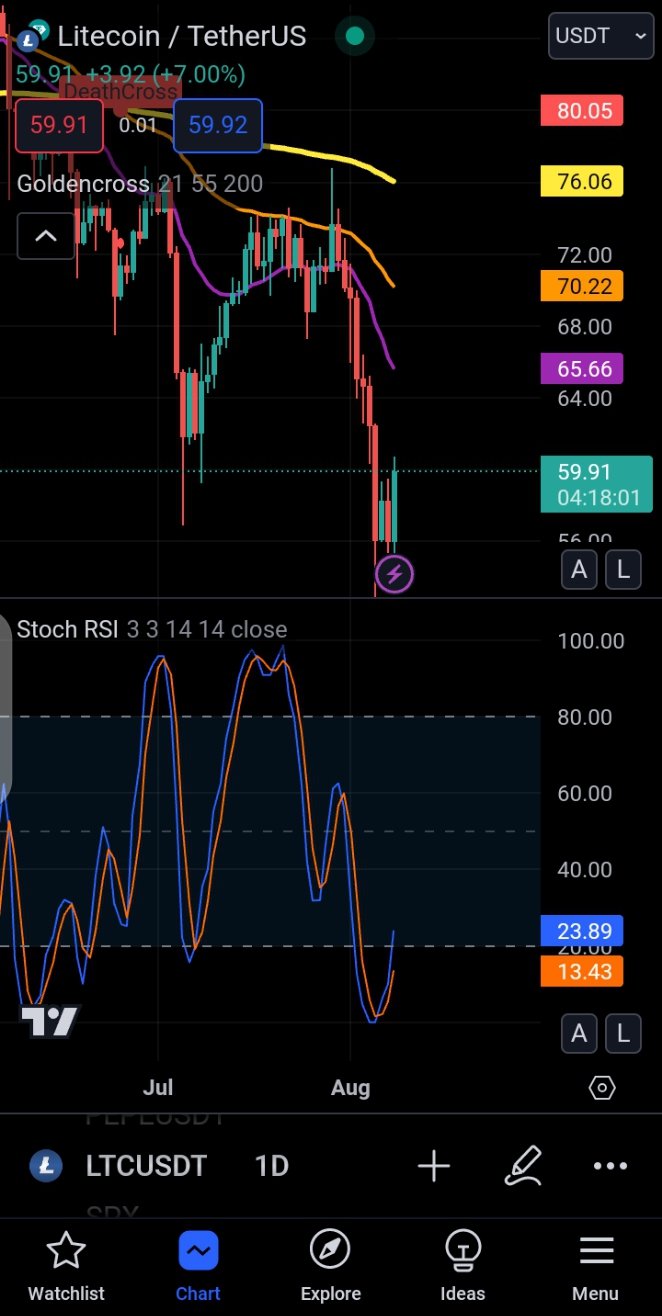
The Stochastic RSI oscillates between 0 and 1 (or 0 and 100 if scaled), and the following key levels are typically used to interpret its signals:
- Above 0.8 (or 80): The market is considered to be in an overbought condition, which might signal a potential downturn or a pullback in the price.
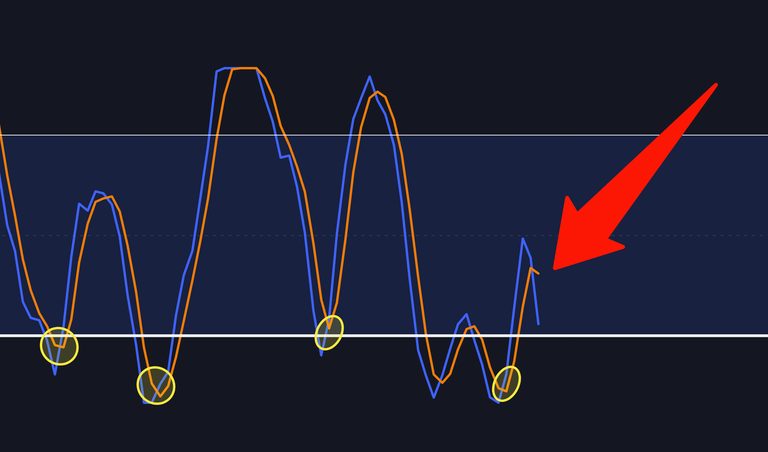
- Below 0.2 (or 20): The market is considered to be in an oversold condition, indicating a potential upward reversal or rally😉.
- Crossovers: When the Stochastic RSI crosses above or below certain threshold levels (like 0.2 and 0.8), it can be a signal to buy or sell. For example, a crossover above 0.2 from below could be a buy signal, while a crossover below 0.8 from above could be a sell signal.
Using Stochastic RSI in Trading Strategies
The Stochastic RSI is particularly effective in identifying short-term price momentum and potential turning points. Here are a few ways it can be used:
Overbought/Oversold Conditions:
Traders can look for the Stochastic RSI to move above 0.8 or below 0.2 as an indication that the market is overbought or oversold. However, since strong trends can keep the indicator in these extremes for extended periods, it’s important to use additional confirmation from other indicators or price action.Crossovers:
A common strategy is to buy when the Stochastic RSI crosses above 0.2 and sell when it crosses below 0.8. This approach helps traders catch early momentum shifts.Divergence:
Divergence between the Stochastic RSI and the asset's price can also be a powerful signal. For instance, if the price makes a new low but the Stochastic RSI fails to do so, this bullish divergence might indicate an impending reversal to the upside.Combining with Other Indicators:
The Stochastic RSI is often used in conjunction with other indicators like moving averages, MACD, or the standard RSI to confirm signals and reduce false positives.
Advantages and Limitations
Advantages:
- Sensitivity: The Stochastic RSI is more sensitive than the traditional RSI, providing earlier signals in volatile markets.
- Flexibility: It can be used in various market conditions, including trending and ranging markets.
- Divergence Detection: It helps in spotting divergence, which can be an early sign of a trend reversal.
Limitations:
- False Signals: Its increased sensitivity can lead to more false signals, especially in choppy or sideways markets.
- Overreliance: Solely relying on Stochastic RSI without considering other factors can lead to poor trading decisions.
Conclusion
The Stochastic RSI is a powerful tool for traders looking to gain a deeper understanding of market momentum and identify potential reversal points. By combining the best aspects of the RSI and Stochastic Oscillator, it provides a more responsive and nuanced approach to technical analysis. However, like all indicators, it is most effective when used in conjunction with other tools and a solid understanding of market conditions. Whether you are a short-term trader looking for quick opportunities or a long-term investor aiming to optimize entry and exit points, the Stochastic RSI can be a valuable addition to your trading toolkit.
NB: This post is for educational purposes alone. Before you trade, make sure you're level headed and know what you're doing. Money is hard to come by these days. Be careful.
Have a wonderful day ahead. I'll catch you on the next one ✌😉.